Forex trading is the process of buying and selling currencies to profit from changes in their exchange rates. Since the market is unpredictable and influenced by many factors, traders use indicators and tools to make smarter decisions. These indicators give insights into trends, while tools help with analysis, planning, and risk management. This guide explains some of the most common indicators and tools used by forex trader.
What Are Indicators and Tools in Forex?
Indicators are formulas or calculations applied to price charts to help traders understand market behavior, trends, and possible reversals.
Tools are resources or platforms, such as calculators and trading apps, that support traders in managing risks, setting goals, and executing trades.
Some indicators predict future movements (leading indicators), while others confirm trends (lagging indicators). Using a mix of both is often the key to successful trading.
Popular Forex Indicators
1. Moving Averages (MA)
Moving Averages smooth out price data to reveal the overall market trend.
Simple Moving Average (SMA): Average price over a specific period.
Exponential Moving Average (EMA): Puts more weight on recent prices, making it more responsive to changes.
How to Use It:
If a short-term MA crosses above a long-term MA, it’s a buy signal (called a Golden Cross).
If it crosses below, it’s a sell signal (Death Cross).

2. Relative Strength Index (RSI)
RSI measures how fast prices are rising or falling, ranging from 0 to 100.
Above 70: Market is overbought (might fall soon).
Below 30: Market is oversold (might rise soon).
How to Use It:
RSI helps you spot when the market is overheated and likely to change direction.

3. Moving Average Convergence Divergence (MACD)
MACD shows the relationship between two EMAs (usually 12 and 26 periods) and helps identify trends and momentum.
Buy signal: When the MACD line crosses above the signal line.
Sell signal: When it crosses below the signal line.
It can also show divergence—if the price moves one way, but the MACD moves the other, it hints at a potential reversal.

4. Bollinger Bands
Bollinger Bands are made up of a moving average with two bands placed above and below it, showing volatility.
Upper Band: Indicates overbought conditions.
Lower Band: Indicates oversold conditions.
How to Use It:
If the bands are wide, the market is volatile. If they narrow, the market is calm, which may signal an upcoming price movement.

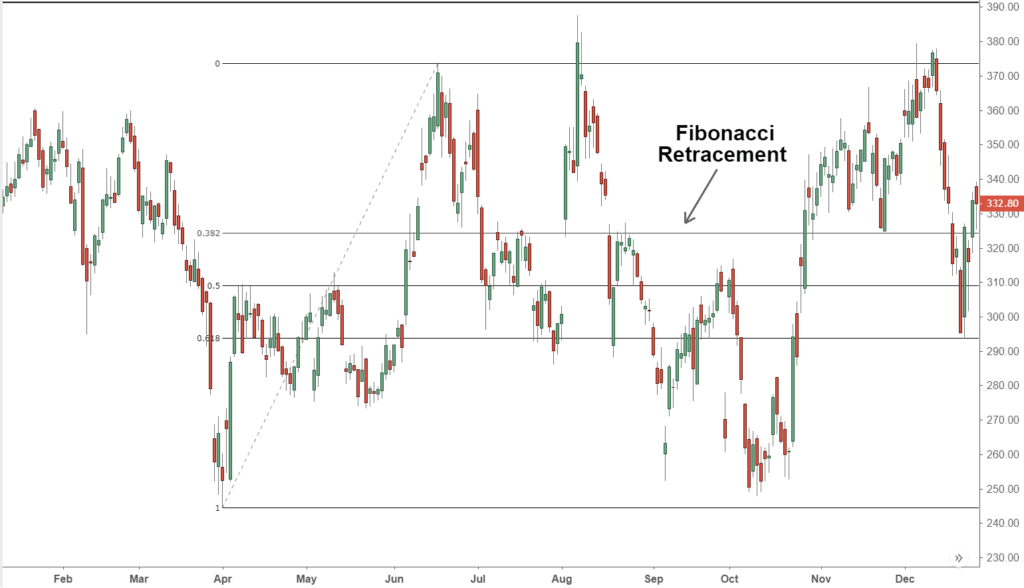
5. Fibonacci Retracement
This tool identifies potential support and resistance levels where prices may bounce back. Common levels include 23.6%, 38.2%, 50%, and 61.8%.
How to Use It:
Traders use Fibonacci levels to plan when to enter or exit trades during price corrections.
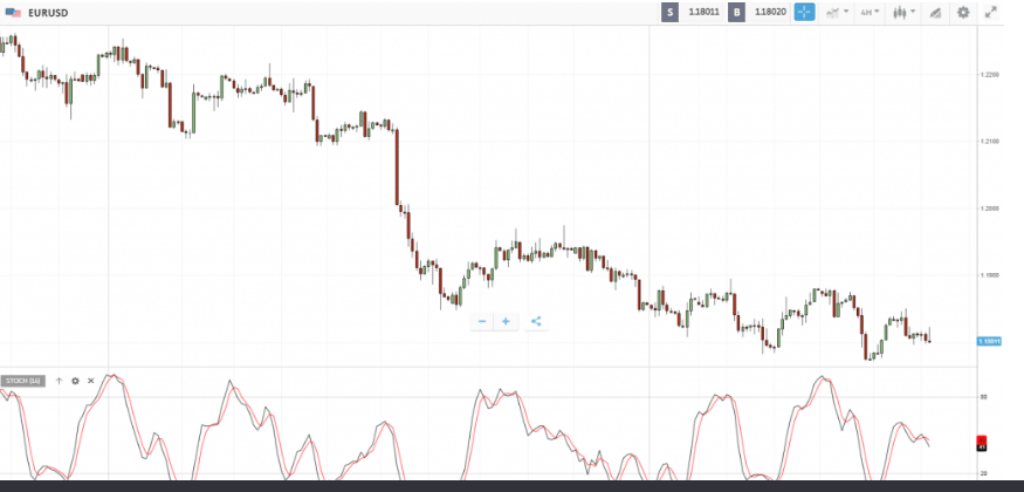
6. Stochastic Oscillator
This indicator compares the closing price to the price range over a period, also ranging between 0 and 100.
Above 80: Overbought (may fall).
Below 20: Oversold (may rise).
Essential Forex Trading Tools
1. Economic Calendar
Tracks major events like central bank meetings or economic data releases (e.g., inflation reports). These events often cause sudden market movements.
How to Use It: Traders avoid opening trades before big announcements to avoid unexpected losses.
2. Position Size Calculator
Helps traders decide how much money to risk on each trade based on their account size and risk tolerance.
How to Use It: Proper position sizing ensures you never lose more than a safe percentage of your total capital on any trade.
3. Currency Correlation Tool
This tool shows how different currency pairs move in relation to each other.
How to Use It: For example, if EUR/USD and GBP/USD are positively correlated, you wouldn’t want to trade both at the same time, as it increases risk.
4. Trading Platforms (MetaTrader, TradingView)
Trading platforms provide access to forex markets and come with charting tools, indicators, and automation options.
How to Use It: Some platforms let traders set up automated strategies using Expert Advisors (EAs), which trade on their behalf based on predefined rules.
5. Sentiment Analysis Tools
These tools show how other traders are positioned (e.g., how many are buying vs. selling).
How to Use It: If too many traders are buying, the market may be overconfident, suggesting a potential price drop.
Combining Indicators and Tools for Better Results
Using a single indicator may not be enough to make confident decisions. Combining multiple indicators and tools often gives better results.
Example Strategies:
Trend-Following Strategy: Use Moving Averages to spot the trend and RSI to confirm the momentum before entering.
Breakout Strategy: Use Bollinger Bands to identify market volatility and Fibonacci to set price targets.
News Trading: Use the economic calendar to avoid risky periods, and sentiment analysis tools to gauge market expectations.
The key is to use a mix of indicators and tools that complement each other, without cluttering your charts with too many signals.
Indicators and tools are essential for navigating the forex market. They help traders spot trends, manage risks, and make more informed decisions. Some indicators, like the RSI and MACD, give signals about market movements, while tools like position size calculators and economic calendars help with planning and risk management.
However, no indicator or tool is foolproof. The forex market is unpredictable, so it’s important to practice with a demo account before trading with real money. By combining the right indicators and tools, traders can increase their chances of success and better handle the ups and downs of the market.